The Ultimate Guide to Benchmarking Diversity in UK Tech
Diversity is all about having a strong representation of all of the different social groups that make up society. To understand how you’re doing when it comes to diversity, compare your company makeup against peers in your industry and location. This article guides you through benchmarking diversity, and how to use this data to inform your D&I strategy.
What is benchmarking diversity?
Benchmarking is all about understanding how you compare. It’s basically a fancy keyword for comparison. You look at representation figures of different demographic groups to compare your company makeup against your peers.
To get a good picture of where you stand when it comes to diversity, you need to understand your company makeup and how you compare. Not just to your peers in the industry, but also to the makeup of your local community.
What is typical across other companies, similar to yours? How well do you represent the groups in your community and industry?
Equipped with this data, you’ll get a strong idea of what good looks like, and what you should be aiming for.
Where do we start with benchmarking diversity?
We hear this question time and time again — it’s one of the first things on the mind of founders and teams we speak to.
Diversity means having a strong representation of all the different groups in society at large. The conversation usually centres on gender and ethnicity, but true diversity encompasses invisible characteristics too, such as sexuality, religion, socio-economic status, disability and more.
By benchmarking your diversity, you can understand how you compare to others, measure the impact of your initiatives and focus your D&I strategy.
So let’s dive in!
Representing the community: location benchmarks
To find the best comparison, it’s important to start local. Does your company makeup reflect the social groups present in your broader community?
Having a good grasp of diversity data will help you better understand which groups are well- and under-represented in your company.
For the sake of this post, let’s assume you’re a UK-based startup, headquartered in London. You’ve just finished collecting diversity data. Let’s find the best comparison, shall we?
There are 3 basic steps:
- Find population-level data. Start by looking at the UK Census. It gives lots of insight into population-level statistics. For example, it will tell you that the gender split in the UK is nearly perfect. Women make up 51% of the population, and men 49%.
- Get local. Statistics vary between regions in the UK. Where possible, compare your data against city-level demographic data.
- Restrict data to the working population. To keep your comparisons specific and relevant, you’ll want to know how your company make-up compares to the demographics of people in employment. By adding the employment rate into the equation, you get a good sense of the representation of various groups in the UK’s working population.
We’ve done these calculations for you.
To help you get started, we’ve listed our location-based benchmarks for ethnicity, gender, sexuality and education level. Much more goes into diversity, such as neurodiversity, disability, generation, religion or mental health. Then there’s intersectionality to consider, where you look not at 1 characteristic at a time (gender or ethnicity), but their intersection (gender and ethnicity).
Let’s start simple:
Women
-
UK → 49.8%
-
London → 47.3%
Men
-
UK → 50.2%
-
London → 52.7%
What about gender minorities?
People who are transgender, identify as gender nonconforming or non-binary make up about 0.7% of the UK population. It is important to include these options when you ask employees to disclose their gender – male or female doesn’t cover it.
Underrepresented ethnic groups (Black, Asian, Mixed heritage, Other ethnicities)
-
UK → 13%
-
London → 35%
White people
-
UK → 87%
-
London → 65%
University-educated
-
UK → 43%
-
London → 59%
Without university degree
-
UK → 57%
-
London → 41%
Heterosexual
-
UK → 93.7%
LGB (Lesbian, Gay, Bisexual)
-
UK → 2.7%
How does your company stack up against these numbers?
Does the representation of different groups reflect the figures here? If not, this could be a sign that you need to take a closer look at your practices. Let’s start with hiring.
It may be that you’re not sourcing candidates widely enough, or that your candidate evaluation processes favour candidates that look, talk and act like the majority of employees within your company. Or perhaps your careers page gives some candidates the feeling they wouldn’t fit in.
Here’s an example from one of our favourite podcasts, WorkLife. Professor Adam Grant talks about a VC fund that featured polo and golf on their careers page, to show off the things they get up to after work. As someone who didn’t grow up playing these sports, how would you feel? Belonging is a fickle thing: small hints of exclusion can make all the difference.

Now you have some broad insight, you might want to dig deeper. For example:
- What % of leadership roles are held by women and people of colour?
- What % of technical roles are held by women and people of colour?
We can find comparisons by looking at UK-wide data, but it’s much more powerful to look at these statistics through the lens of industry data.
Diversity in the tech industry
You can’t rely on government data to get deep insight into diversity in tech.
Luckily, we’ve seen quite a few tech-focused reports hitting the headlines in the last year. The State of European Tech and Tech Nation‘s reports are our favourites, Extend Ventures’ Diversity beyond Gender and The Black Report are packed with relevant stats too.
There’s no standardised way to collect and report diversity data though, and most reports rely on a (voluntary) sample of tech companies. With these limitations in mind, you can still draw some relevant comparisons. Here’s a handful:
Working in the tech industry
-
Women, overall: 25.5% (Tech Nation)
-
People of colour, overall: 31% (Hired)
-
People of colour, London: 33% (BCS Chartered Institute of IT)
-
Age under 35: 42% (Tech Nation)
Leadership in tech
-
Women directors: 13% (BCS Chartered Institute of IT)
-
People of colour, senior leaders: 11% (Inclusive Tech Alliance report)
-
Directors with non-British nationality: 18% (Tech Nation)
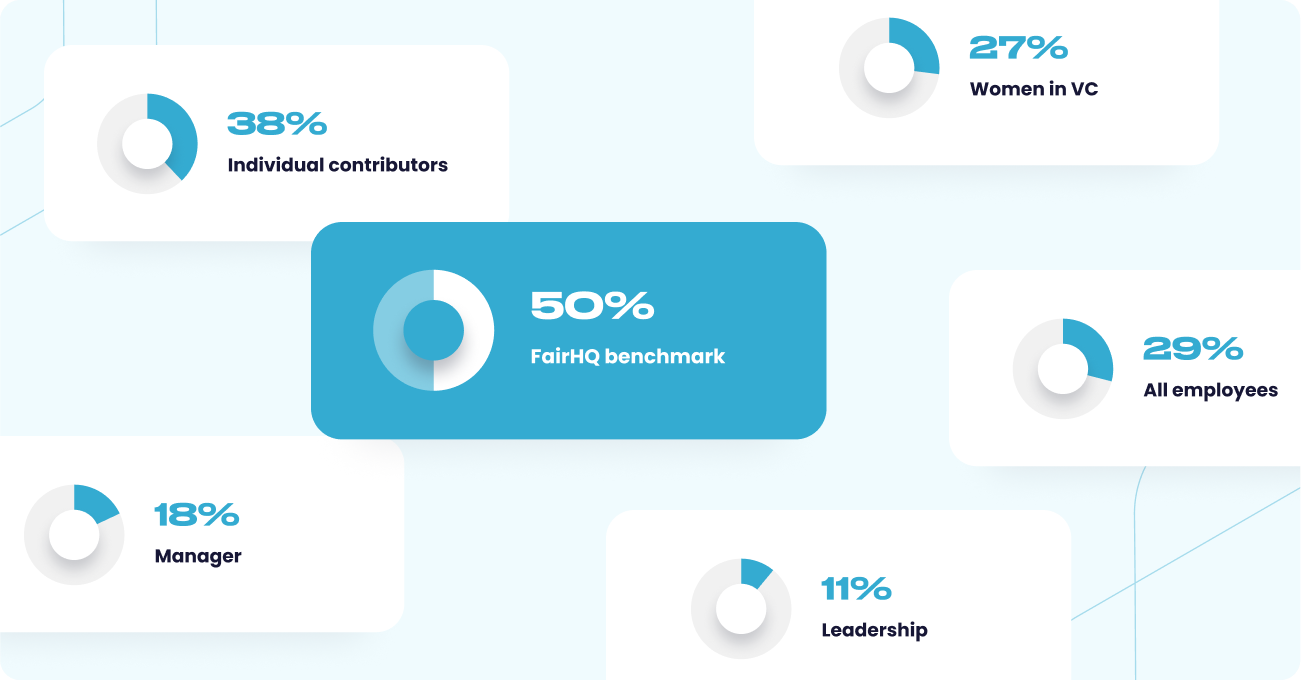
Our Fair HQ benchmarks
Our Fair HQ platform helps companies measure and improve Diversity and Inclusion. One of the most essential (and popular) parts of the product is benchmarking that helps companies understand how they are doing in comparison to others.
At Fair HQ, we believe businesses should strive towards 50/50 gender parity across the whole organisation. Women represent roughly 50% of the UK working population, and research shows that gender-balanced teams perform better than those that have only a small proportion of either gender represented. It’s what we score companies against in our diversity dashboard. If you’re a long way off – especially at manager or leadership levels – don’t fret. It is a long-term goal to strive towards!
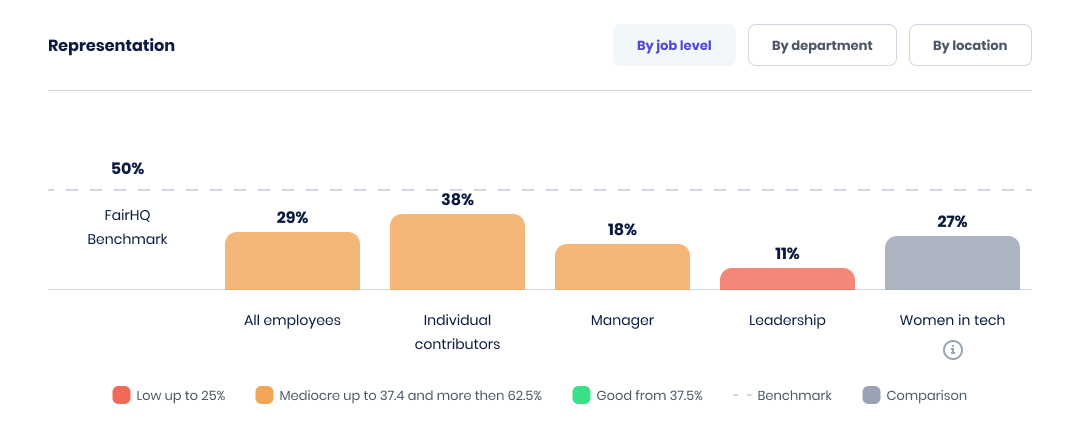
When it comes to the representation of people of colour, we’ve set the industry benchmark for tech at 31%. Again, it’s an ideal to strive towards – especially if your HQ is based in London, where people of colour are well represented in digital jobs at 30.1%.
Diversity isn’t only about gender and ethnicity.
Here we’ve talked mostly about a few diversity attributes to illustrate how we go about benchmarking. We collect 15+ identities and social indicators in our D&I survey that helps companies collect diversity data from their employees, confidentially and GDPR- compliant.
Once you have a clearer idea of how you compare, it’s time for action. Benchmarking yourself against location and industry data will empower you to have informed conversations with your team – and remember, it’s only the starting point.
Sinead Daly, Beamery‘s Director of Culture and Experience, told us all about the power of comparison when setting diversity targets:

Sinead is working with leaders and managers to develop a realistic roadmap to get to where they want to be in terms of diversity. You’ll soon be able to read more about Beamery’s D&I journey in their upcoming Fair HQ case study. Stay tuned.
In the next post, we talk about setting evidence-based and actionable diversity goals. See you there! 👋
✅ Checklist of actions:
- Collect (confidential & voluntary) diversity data from your employees.
- Go beyond measuring gender and ethnicity for real insight.
- Compare your diversity numbers against your location and industry to understand the biggest gaps and identify where progress needs to be made.
- Use these data points to guide your diversity goals – where are you falling short? And most importantly, where do you want to get to in the next 12 and 24 months?
- Measure diversity in your company at least once a year to see the impact of changes you made.
Backing it up
10×10 & Google for Startups (2020) ‘The Black Report‘
Extend Ventures (2020) ‘Diversity Beyond Gender’
Gov UK (2018) ‘Male and female populations‘
Grant, A. (Host). (2021) ‘How to Build an Inclusive Workplace‘ [podcast] In Worklife with Adam Grant, TED
Hoogendoorn, S. et al. (2013) ‘The Impact of Gender Diversity on the Performance of Business Teams: Evidence from a Field Experiment’ Management Science
Tech Nation (2021) ‘Diversity and inclusion in UK tech companies‘
Atomico (2020) ‘The State of European Tech 2020‘